Logging
Logging sub system is built to survive outages of individual hosts and network failures.
All collected logs are saved locally in aggregated (combined) host log file which is available in host directory /var/data/fluentd for cases when dashboards are not available due to backoffice node failure.
In case if there are network failures logs are saved in separate buffer files and are resent to log aggregation host when it becomes available.
Similarly in case of elasticsearch failure logs are saved to file buffer and re-pushed to elasticsearch when it becomes available.
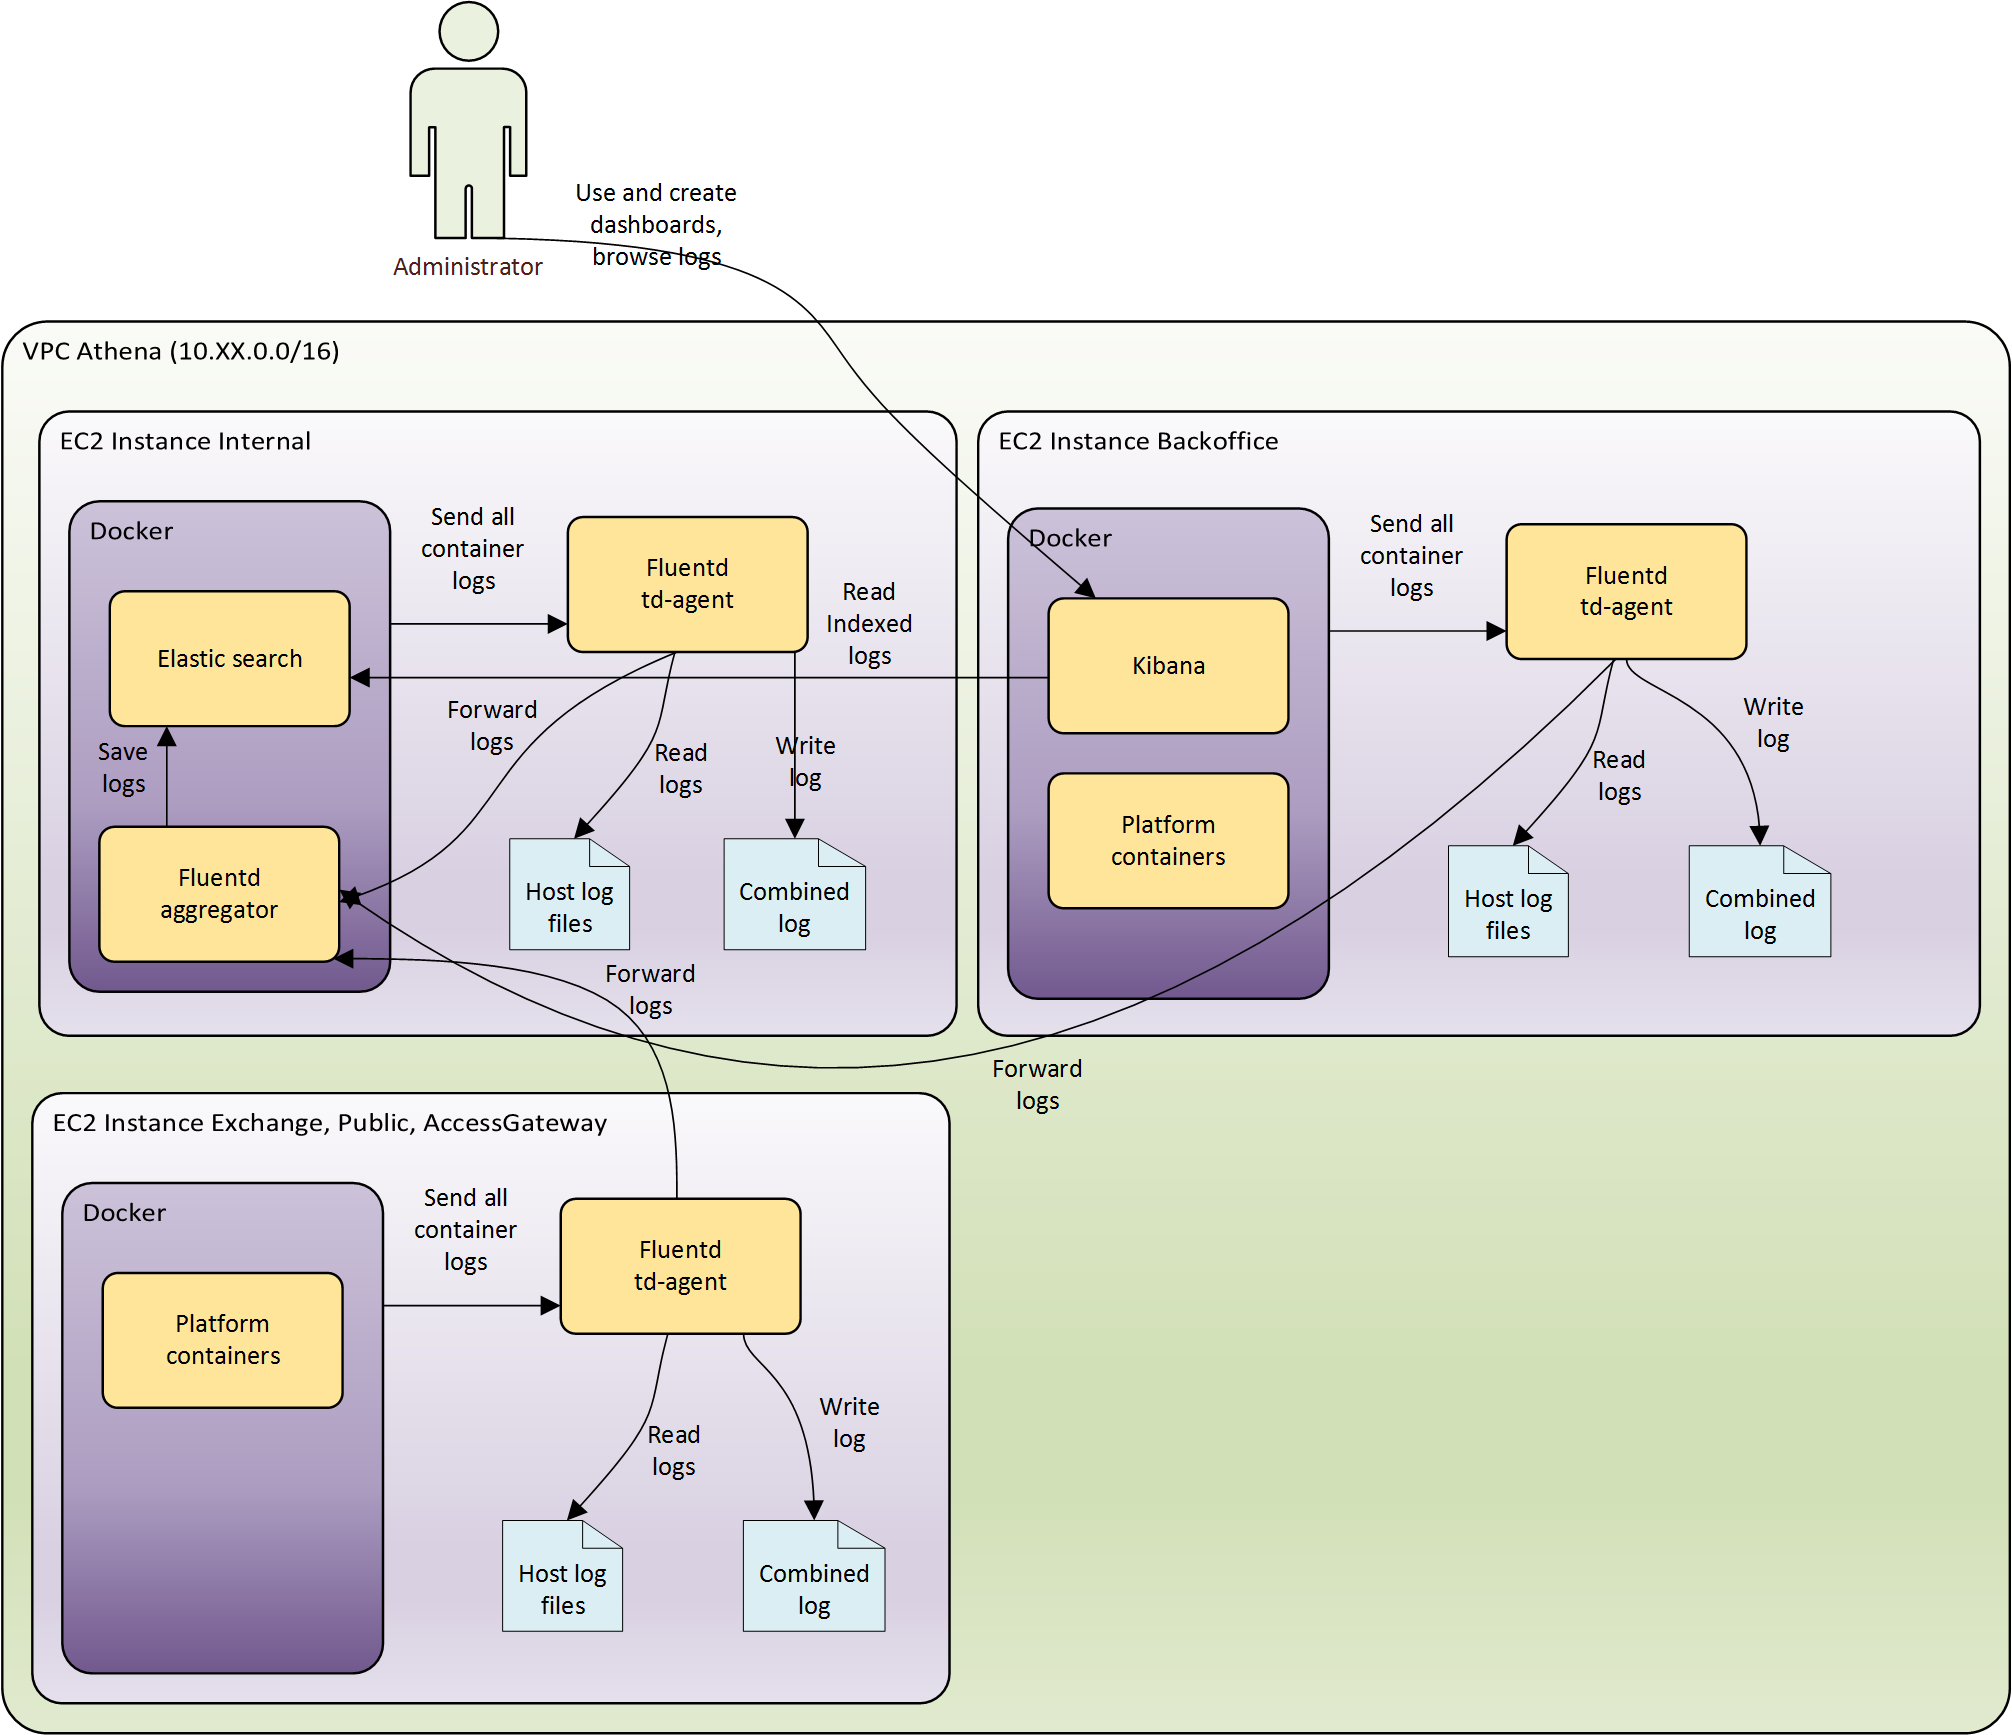
High level logging architecture
Host log files
Platform automatically collects and parses these host files:
/var/log/syslog- host service logs/var/log/auth.log- host authentication logs/var/log/upstart/docker.log- docker machine/service logs/var/log/apache2/athena.log- Athena WAF access logs/var/log/apache2/error.log- Athena WAF error/exception log
Containers
All container logs are automatically collected via docker fluentd log driver.
For Athena to properly assign docker logs to auto-generated kibana dashboard it is necessary to specify label AthenaServiceName which should match with the service name in Consul, For example if kibana container is registered as monitoring it is necessary to pass in label AthenaServiceName: monitoring when launching the container
Example launch configuration with label AthenaServiceName specified:
- name: launch docker kibana image
  docker:
    name: kibana
    labels:
      AthenaServiceName: monitoring
      AthenaLogType: json1
    image: ""
    state: reloaded
    net: ""
    detach: true
    restart_policy: always
    insecure_registry: yes
    volumes_from:
      - kibana-data
    ports:
      - ":5601"
    env:
      ELASTICSEARCH_URL: "http://elasticsearch.service.consul:"
      NODE_OPTIONS: "--max-old-space-size=100"
  become: yes
Dashboards
Athena automatically creates dashboards for all services that are registered in Consul. As well as dashboard per host instance and athena-service-all dashboard which has information about all athena services.
Fields used in Athena dashboards:
athena_service- service or subsystem process nameathena_level- message level one of (DEBUG,INFO,WARNING,ERROR)athena_message- log messageathena_ip- source IP of platform user if availableathena_user- authenticated platform user name or key fingerprint
Please also consider extracting these fields in a new and solution specific services to benefit from automatic platform service dashboard generation.
Log formats
When launching container it is possible to specify one of Athena supported log formats in AthenaLogType label:
httpd_access_log1
Fluentd regex
format /^\[(?<time>[^\]]*)\] (?<http_code>[0-9]*) (?<athena_service>\w*) (?<athena_ip>[^ ]*) (?<athena_user>[\w\.]*) "(?<athena_message>[^"]*)"$/
Sample log input
[15/Aug/2016:14:50:38 +0300] 200 nexus 87.110.178.218 janis.upitis "GET /content/repositories/releases/com/knowledgeprice/athena/athena-crm-dal/2.498/athena-crm-dal-2.498.jar HTTP/1.1"
httpd_error_log1
Fluentd regex
format /^\[[^ ]* (?<time>[^\]]*)\] \[(?<level>[^\]]*)\] (?:\[pid (?<pid>[^\]]*)\])? (?:\[client (?<athena_ip>[^\]]*)\])?(?<athena_message>.*)$/
Sample log input
[2016-08-15 14:30:22.882523] [authz_core:error] [pid 12846:tid 140095919154944] [client 87.110.178.218:58676] AH01630: client denied by server configuration: proxy:http://nexus.service.consul:10180/content/repositories/releases/com/google/guava/guava/maven-metadata.xml
generic1
Fluentd regex
format /^(?<time>[^ ]*\s*[^ ]* [^ ]*) (?<host>[^ ]*) (?<athena_service>[a-zA-Z0-9_\/\.\-]*)(?:\[(?<pid>[0-9]+)\])?(?:[^\:]*\:)? *(?<athena_message>.*?)(?<athena_user>([0-9a-f]{2}:){15}[0-9a-f]{2})?$/
Sample log input
Aug 15 14:50:43 accessgatewaya-athena-dev sshd[10310]: Accepted publickey for ubuntu from 10.99.70.26 port 45790 ssh2: RSA 84:d6:1b:99:e0:b8:7c:65:e0:77:0e:ca:99:5d:62:56
generic2
Fluentd regex
format /^(?<time>\d{4}-\d{2}-\d{2} \d{2}:\d{2}:\d{2},\d{3}) (?<athena_level>\w+) (?<athena_message>.*)$/
Sample log input
2016-08-07 10:11:57,295 INFO success: cron entered RUNNING state, process has stayed up for > than 1 seconds (startsecs)
syslog
Fluentd regex
format /^(?<time>[^ ]*\s*[^ ]* [^ ]*) (?<host>[^ ]*) (?<ident>[a-zA-Z0-9_\/\.\-<>]*)(?:\[(?<pid>[0-9]+)\])?(?:[^\:]*\:)? *(?<message>.*)$/
Sample log input
Aug 15 14:57:52 accessgatewaya-athena-dev ovpn-server[1219]: athena-dev-sergejs.muromcevs/87.110.178.218:59474 MULTI: bad source address from client [fe80::a0a4:af49:80f4:f917], packet dropped
golang1
Fluentd regex
format /^time="(?<time>[^"]*)" level=(?<athena_level>\w+) msg="(?<athena_message>[^"]*)".*$/
Sample log input
time="2016-08-12T09:24:24Z" level=info msg="Checkpointing in-memory metrics and chunks..." source="persistence.go:539"
golang2
Fluentd regex
format /^\s*(?<time>\d{4}\/\d{2}\/\d{2} \d{2}:\d{2}:\d{2}) \[(?<athena_level>[^\]]\w*)\] (?<athena_message>.*)$/
Sample log input
2016/08/14 21:08:17 [INFO] snapshot: reaping snapshot /var/consul/raft/snapshots/7767-1911212-1471074878287
java1
Fluentd regex
format /^\[(?<time>[^\]]*)\]\[(?<athena_level>[^\]]\w*) \](?<athena_message>.*)$/
multiline_start_regexp /^\[([^\]]*)\]/
Sample log input
[2016-08-15 00:01:47,429][INFO ][cluster.metadata ] [Amina Synge] [logstash-2016.08.15] update_mapping [fluentd]
java2
Fluentd regex
format /^(?<time>\d{4}-\d{2}-\d{2} \d{2}:\d{2}:\d{2}\,\d{3}\+\d{4}) (?<athena_level>\w*)\s+(?<athena_message>.*)$/
multiline_start_regexp /^\d{4}-\d{2}-\d{2} \d{2}:\d{2}:\d{2}\,\d{3}\+\d{4}/
Sample log input
2016-08-12 09:03:27,792+0000 INFO [RepositoryStatusChecker-codehaus-snapshots] *SYSTEM org.sonatype.nexus.proxy.maven.maven2.M2Repository-codehaus-snapshots - Next attempt to auto-unblock the "Codehaus Snapshots" (id=codehaus-snapshots) repository by checking its remote peer health will occur in 1 hour 36 minutes.
java3
Fluentd regex
format /^\w{3}\s\w{2},\s\d+\s\d+:\d+:\d+\s\w{2}\s(?<athena_message>.*)(?<athena_level>INFO|DEBUG|ERROR|WARN|TRACE):\s(?<athena_message>.*)$/
multiline_start_regexp /^\w{3}\s\w{2},\s\d+\s\d+:\d+:\d+\s\w{2}/
Sample log input
Aug 15, 2016 11:24:41 AM hudson.model.Run execute INFO: Athena Release/com.knowledgeprice.athena:athena-journey-runtime #580 main build action completed: NOT_BUILT
ruby1
Fluentd regex
format /^(?<time>\d{4}-\d{2}-\d{2} \d{2}:\d{2}:\d{2} \+\d{4}) \[(?<athena_level>\w+)\]: (?<athena_message>.*)$/
multiline_start_regexp /^\d{4}-\d{2}-\d{2} \d{2}:\d{2}:\d{2} \+\d{4}/
Sample log input
2016-08-15 05:00:23 +0000 [info]: gem 'fluent-plugin-elasticsearch' version '1.5.0'
Extending
Please see logging extending guide.